Analytics and reporting
Context: Meta, Documentation Engineering Manager, 2022
Audience: Documentation managers, team members, and operating partners
The department was assigned documentation responsibility for more than 400 internal Enterprise Engineering products. Their documentation wikis contained thousands of pages. A Google Doc tracked the transition work, but it did not give leaders a consistent view of status, dates, risks, and results.
What I built
I extracted the product names from the Google Doc and created a SharePoint tracking database. Writers used it to record status, start dates, end dates, and other project information for documentation work across more than 400 products.
I connected the SharePoint data and other corporate work data to Tableau. I personally created seven automated dashboards with department, project, completed-work, and manager views. My senior manager used the reports to show project status and risks to her director.
How I built the reporting system

Dashboard examples
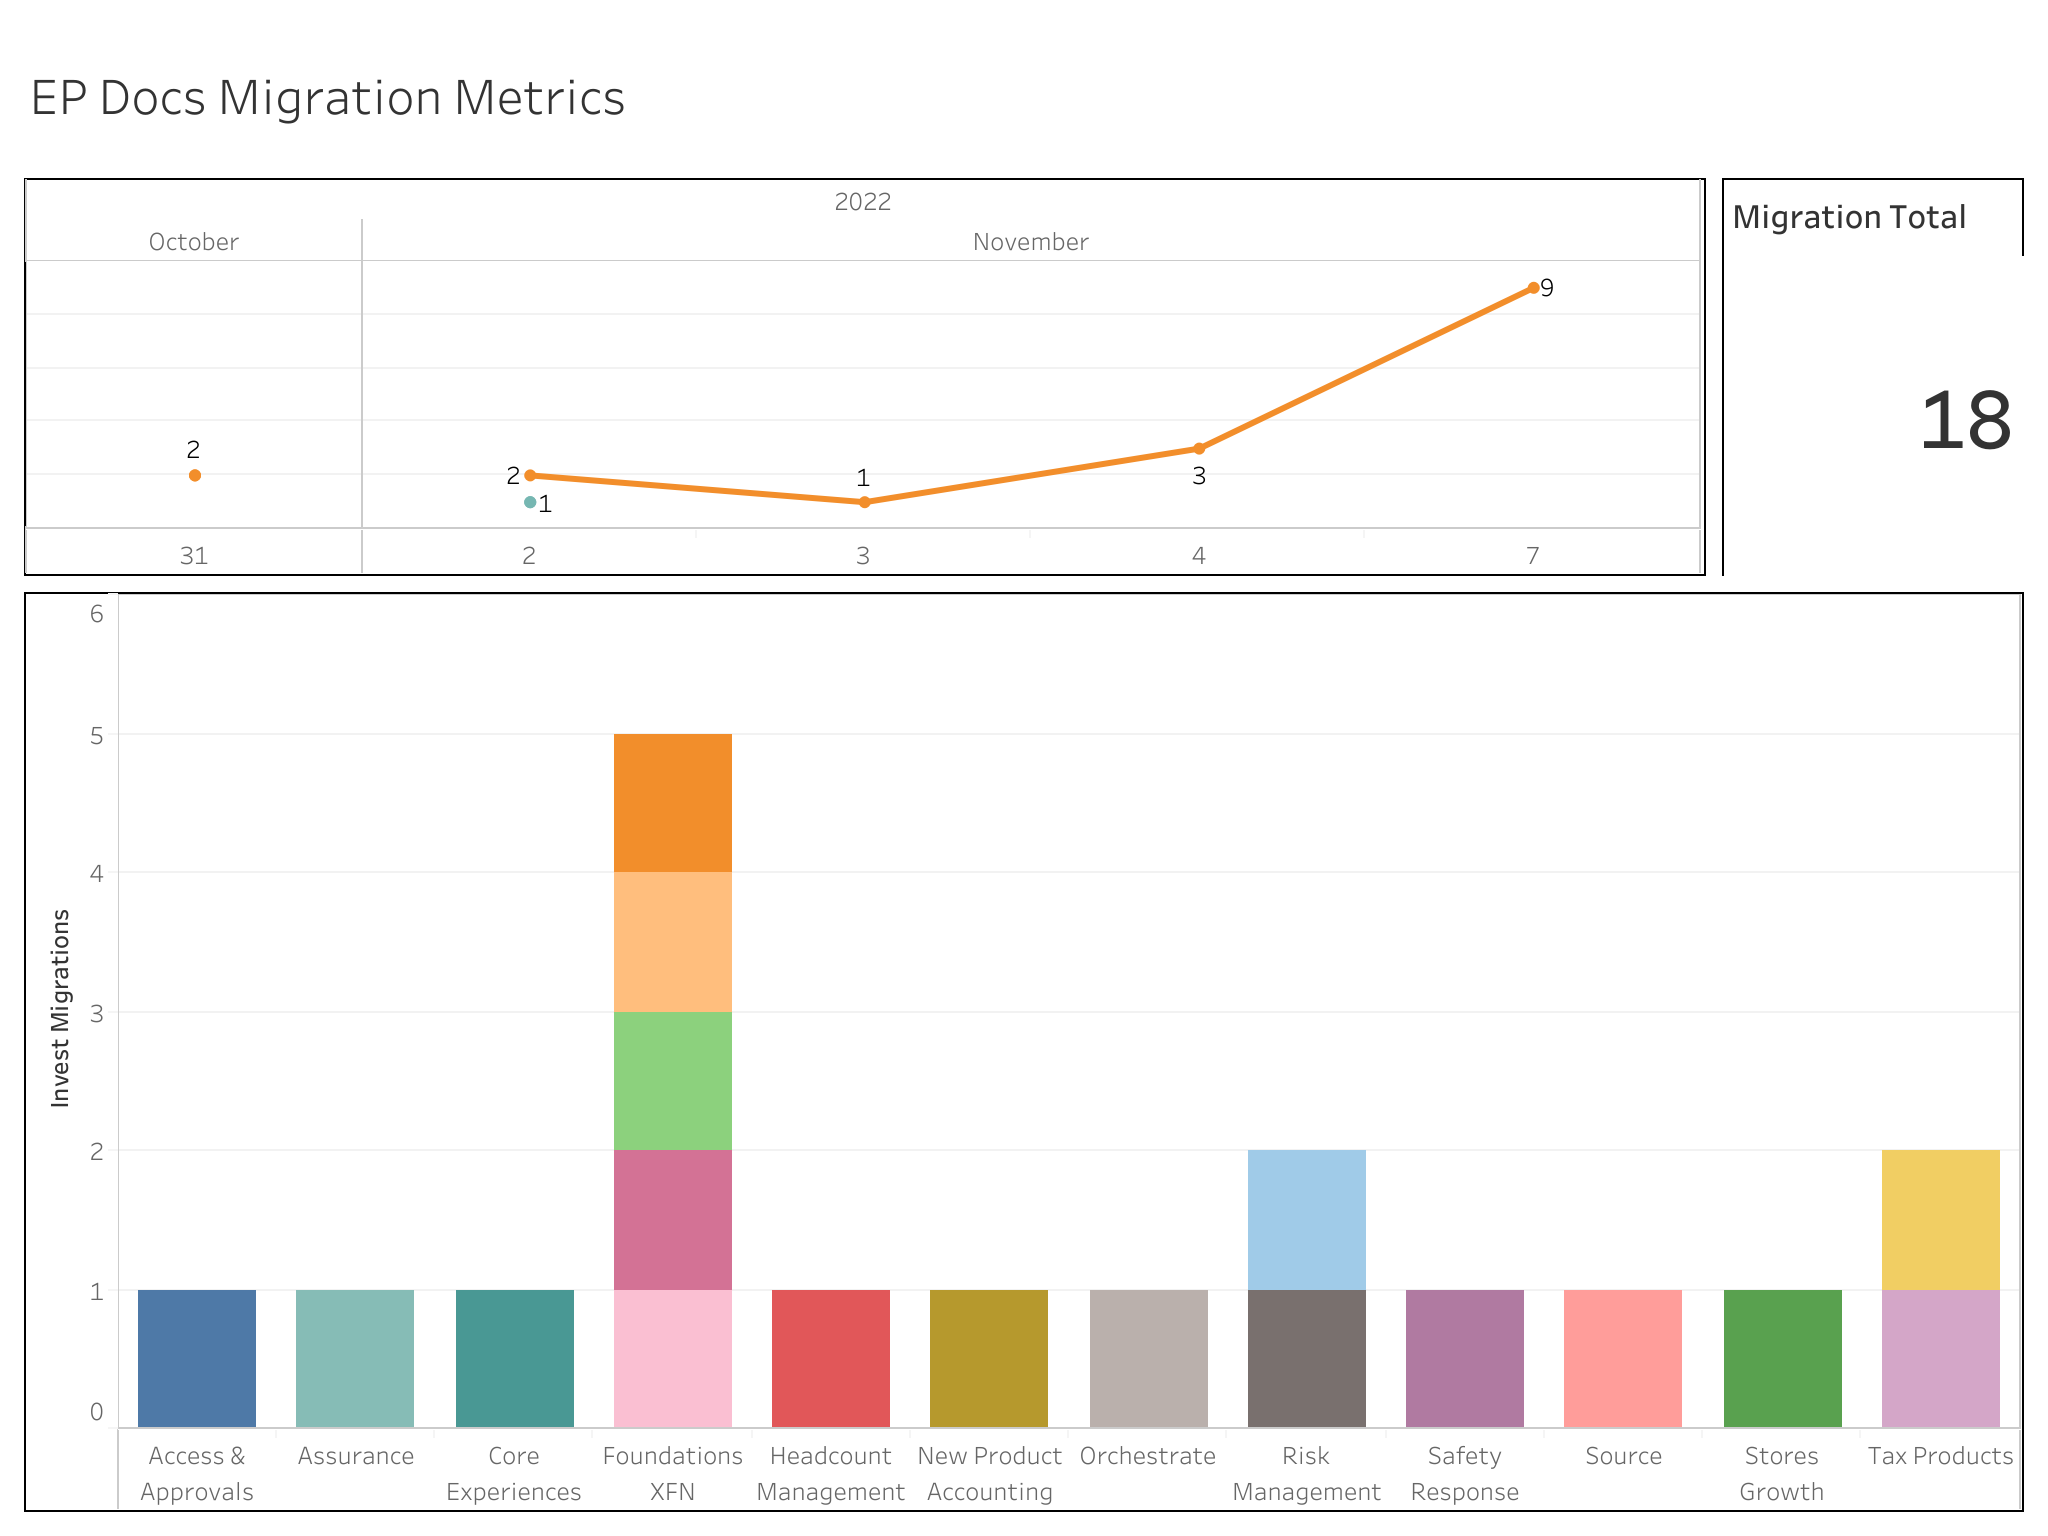
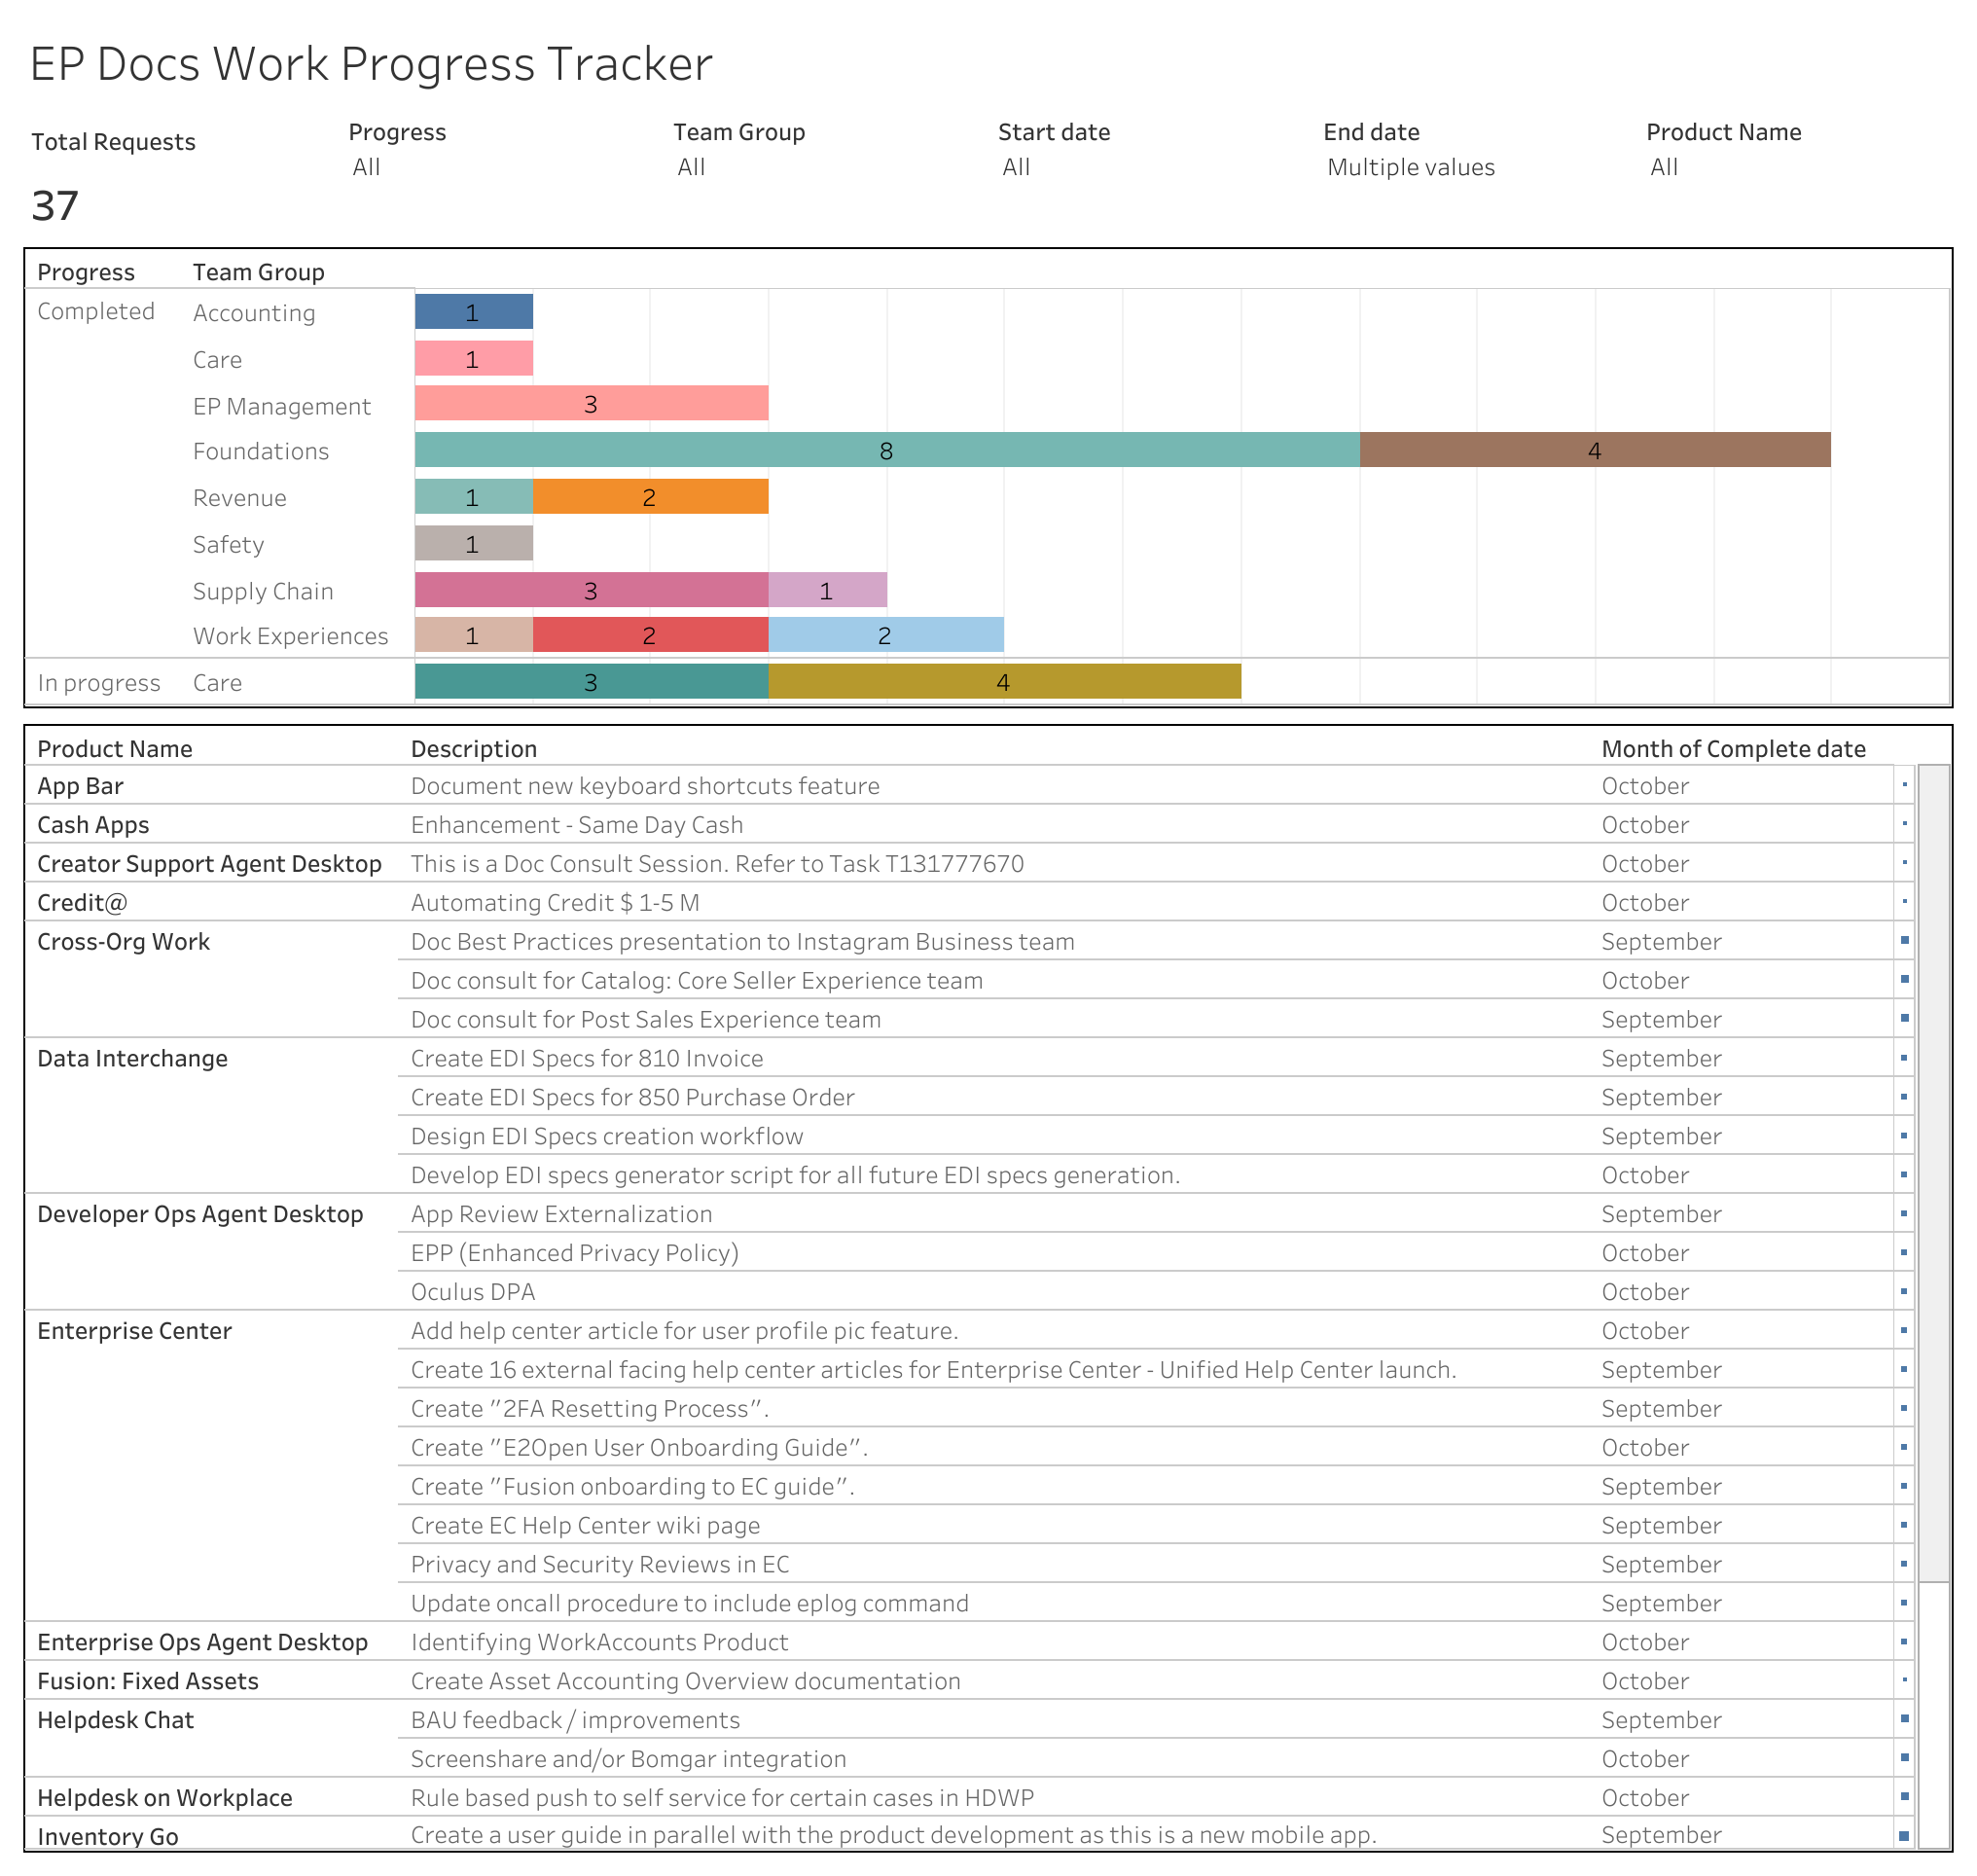
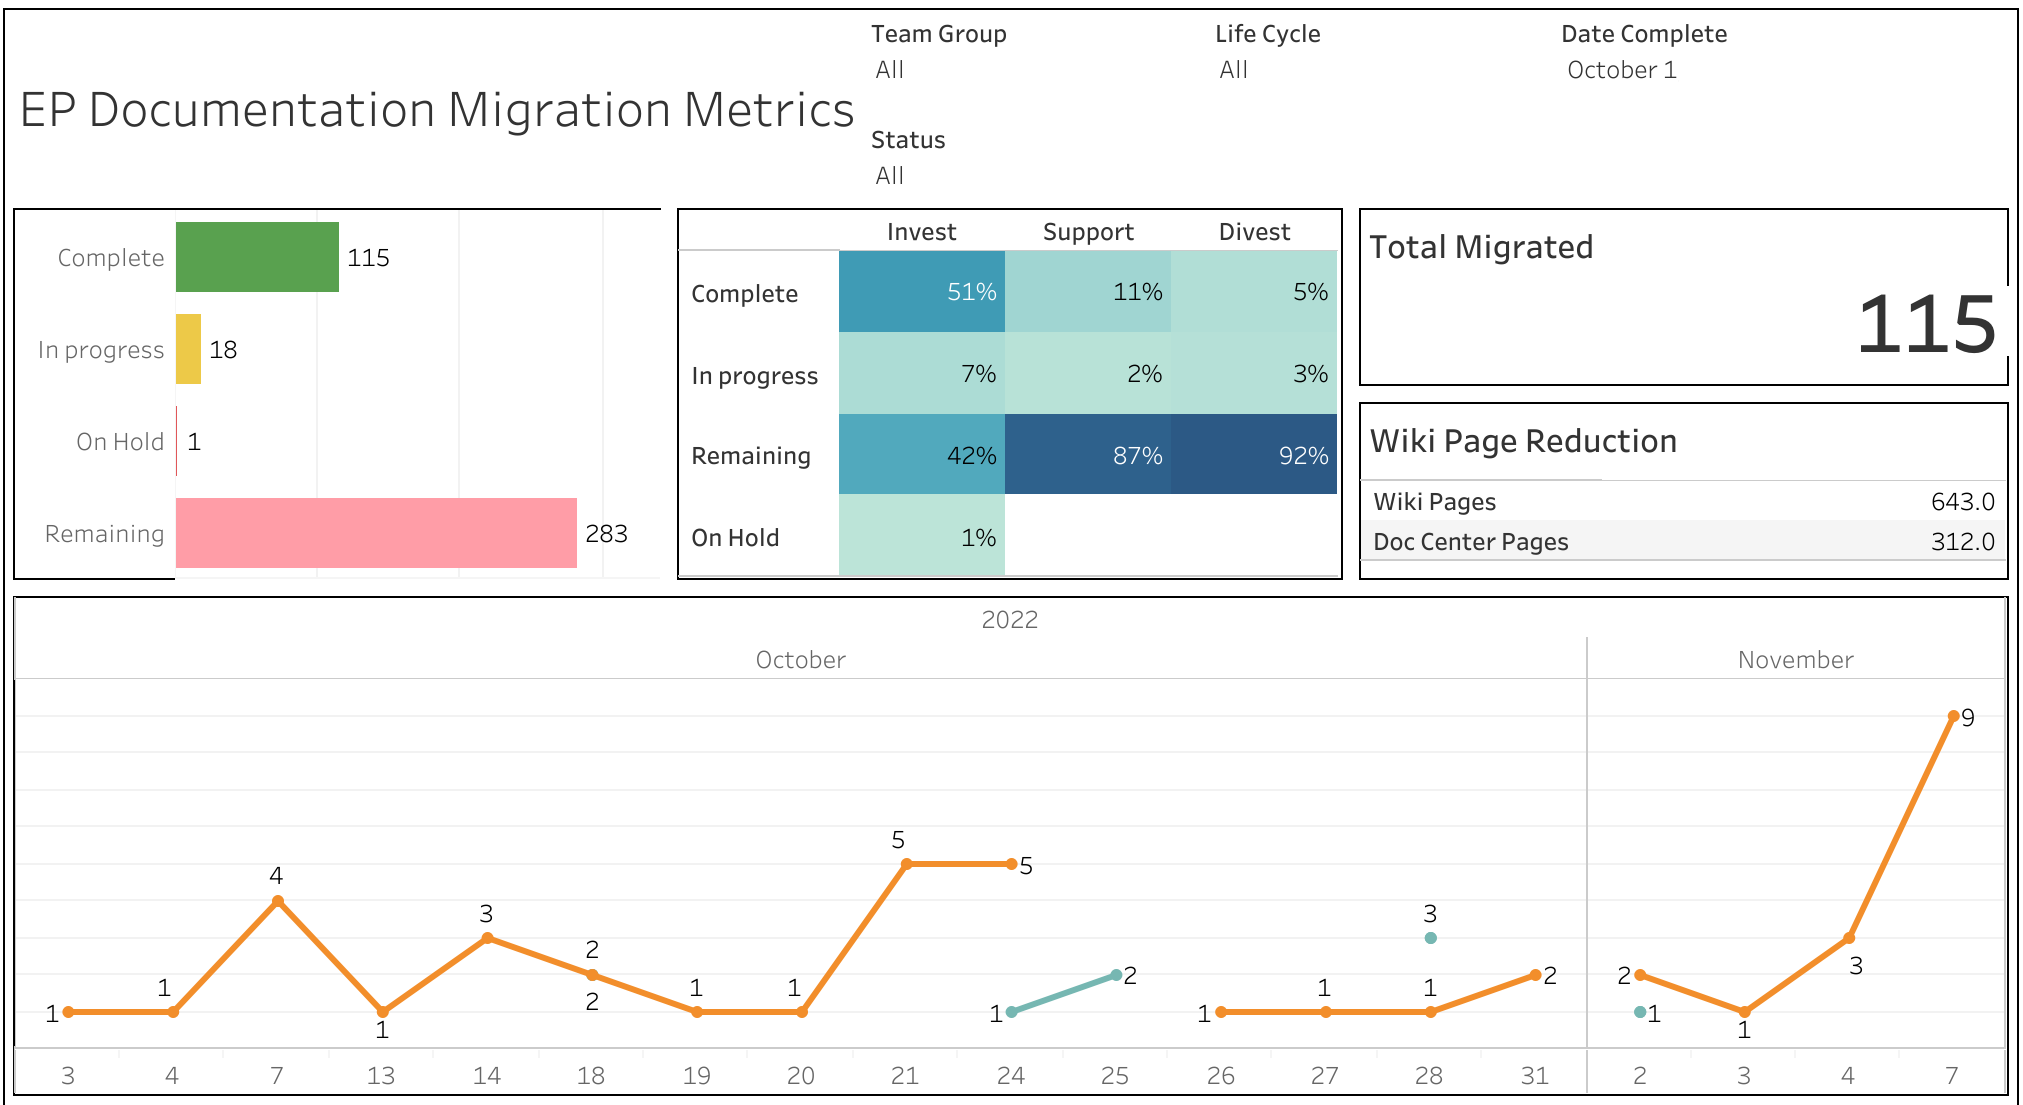
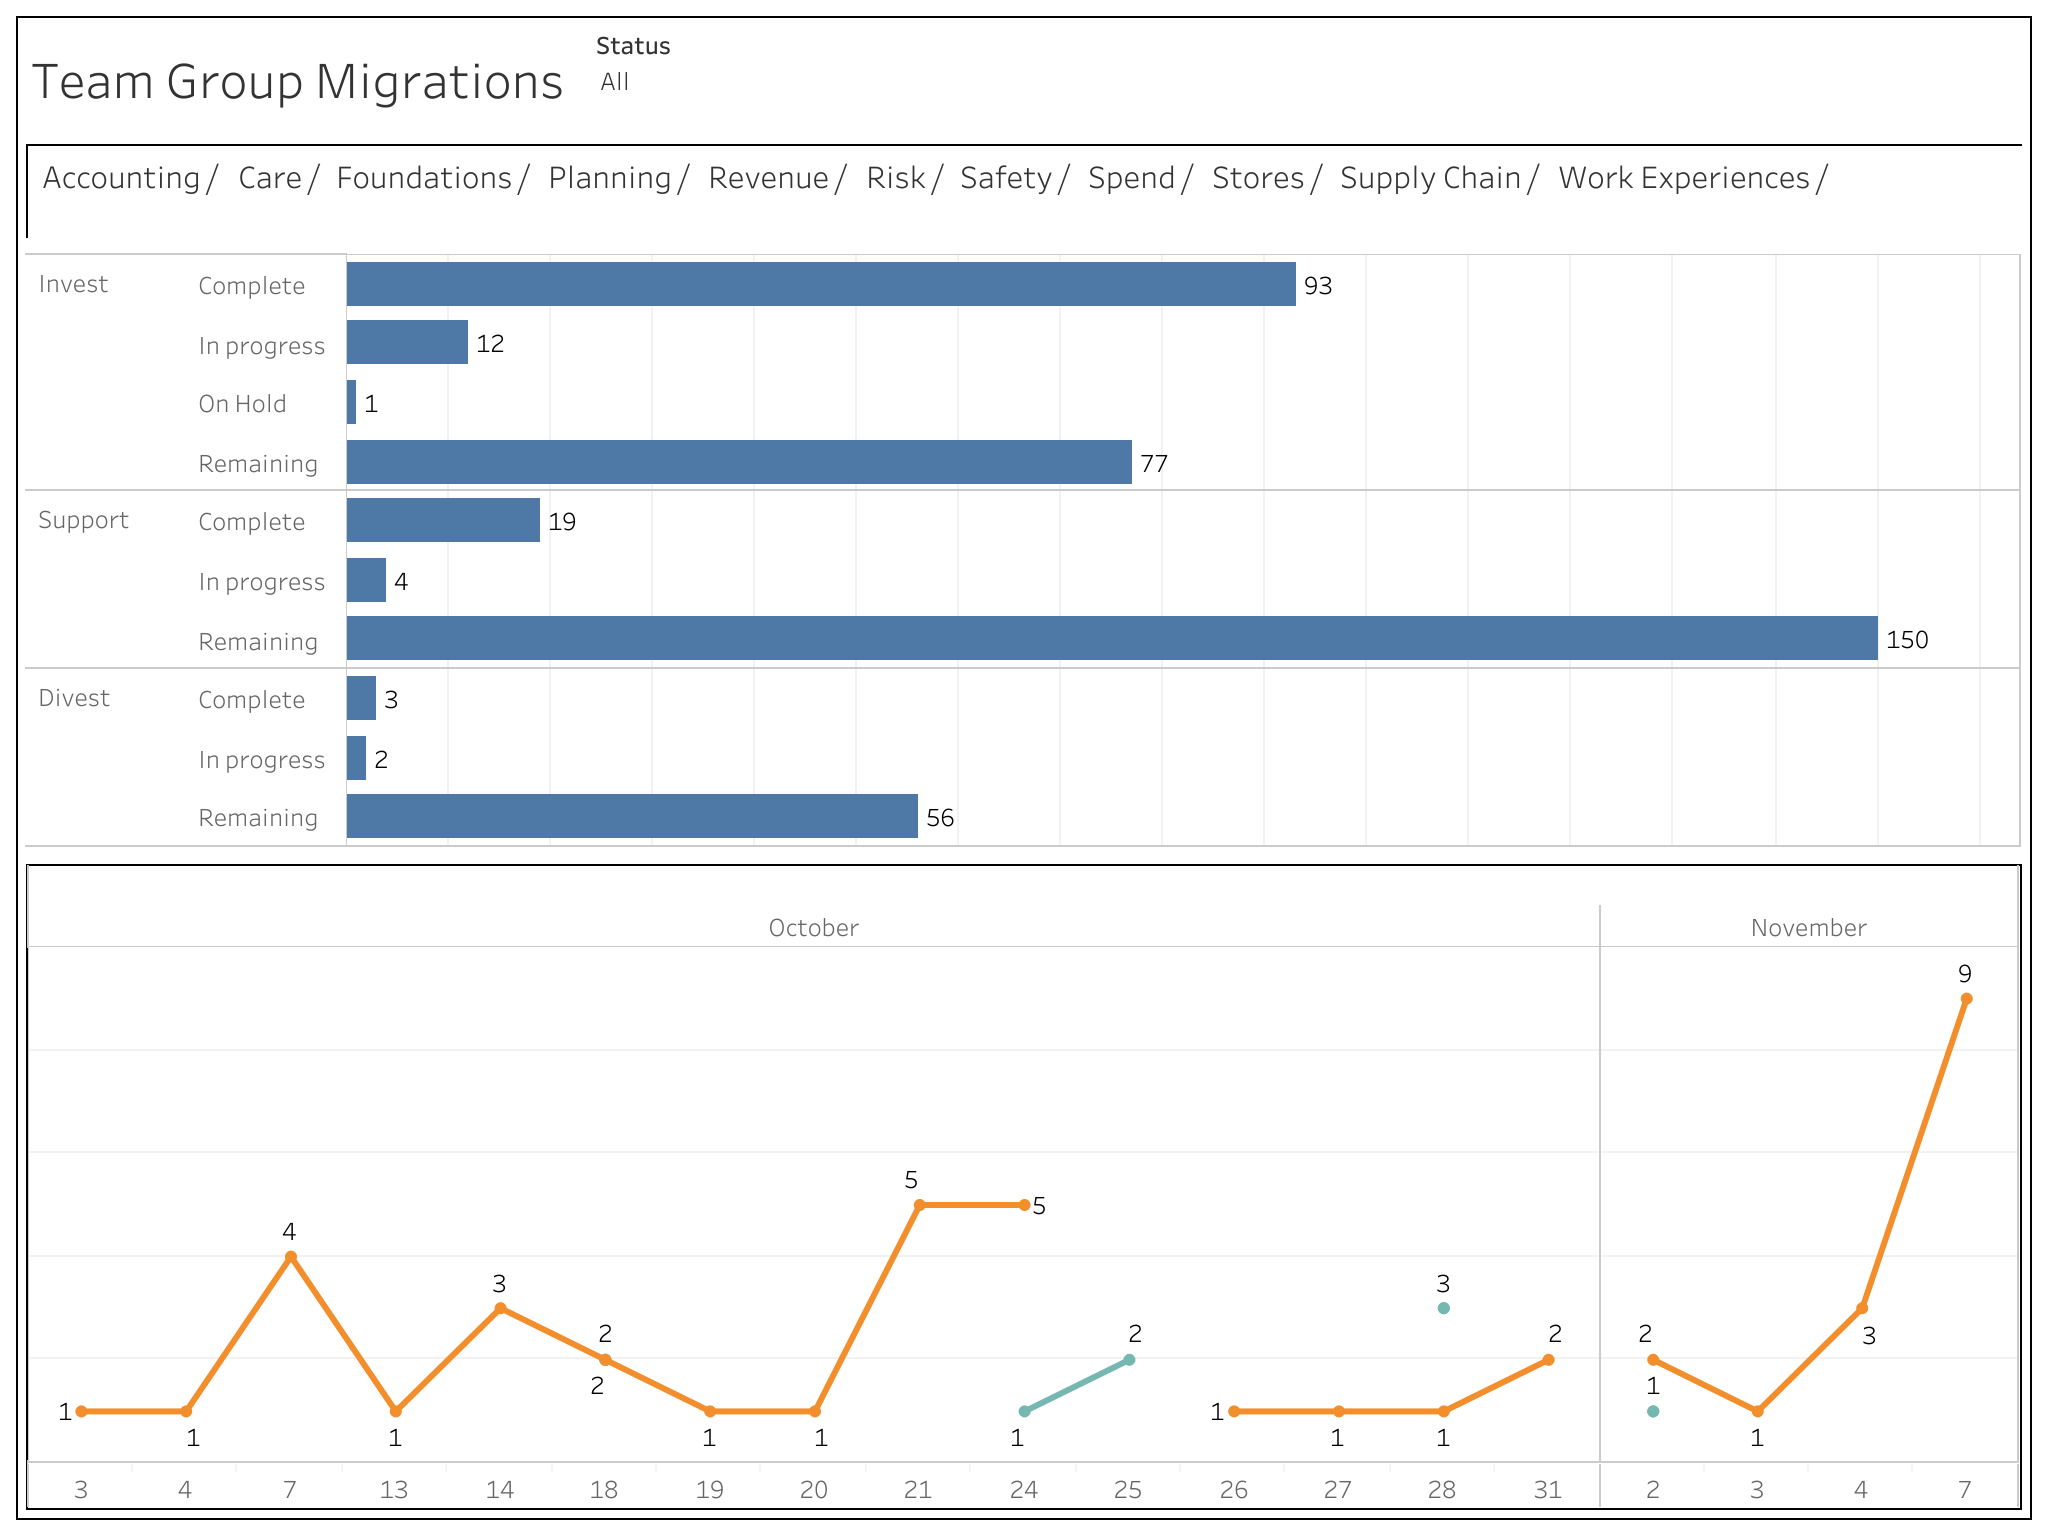
These 2022 Tableau views show two parts of the reporting system. The migration dashboards showed status and completion by team and team group. The work-progress tracker used the SharePoint records to give the team a consistent view of documentation requests for monthly reporting.
Dashboard summary
| Dashboard | What the 2022 view shows | Why it mattered |
|---|---|---|
| Migration activity | 18 completed migrations by date and team group. | The team could see when migrations finished and which groups completed them. |
| Work-request progress | 37 requests organized by status and team group, with product names, descriptions, and completion months. | One view connected the summary measures to the work records used for monthly reporting. |
| Migration status | 115 complete, 18 in progress, 1 on hold, and 283 remaining. The view also shows product life-cycle groups and a reduction from 643 wiki pages to 312 Documentation Center pages. | Managers could review status, content reduction, and completion activity together. |
| Team-group progress | Completed, in-progress, on-hold, and remaining migrations across Invest, Support, and Divest, plus completion activity by date. | Managers could compare progress across groups and see what work remained. |
These dashboard examples show how I tracked activity, status, content reduction, and team-group progress during 2022. The Migrations and information architecture page connects the dashboard views to the final program totals and outcomes.
Supported use and results
- Documentation accomplishment reporting changed from several hours of preparation to less than two minutes per entry.
- The dashboards had 735 views from 39 active users.
- Teams used the dashboards in 11 operations reviews per month and in performance discussions.
- Managers could use consistent measures instead of separate manual reports.